The growth landed disproportionately in the suburbs around the capital: between the 2016 and 2021 censuses the City of St. John's grew 1.5%, while Paradise grew 7.3% and Conception Bay South grew 3.7%. The city's commercial mill rate is 29.5, against 11.5 in Paradise, Conception Bay South and Mount Pearl, and it approved nine of thirty-four new housing construction permit applications in the first quarter of 2026.
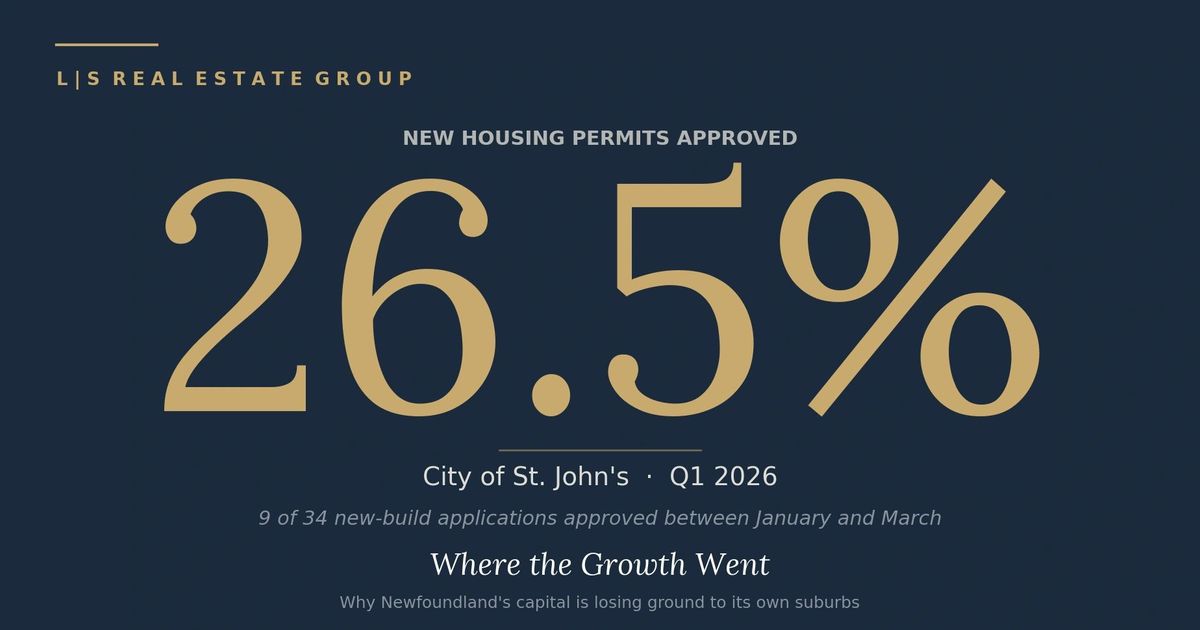
In the first quarter of 2026, the City of St. John's approved nine of thirty-four new housing construction permit applications. That's a 26.5% approval rate.
This is not a misprint. The number comes from the City's own Residential Building Permits Dashboard. Across all of 2025, the City received 223 new-build applications and issued 133 permits — a 60% approval rate. Two out of every five new housing applications submitted to the capital city died in the city's own process, in the middle of a housing crisis the city itself has documented.
The City commissioned a housing needs report in 2023 that projected a unit shortage of 1,025–1,335 today, growing to 3,610–5,310 by 2033. The same year, building permit values in the city had fallen to $213 million — down from $401 million in 2014, a 47% decline in real construction investment over a single decade. The Census Metropolitan Area surrounding the city has grown by roughly 23,000 people since 2021 alone.
The growth came. The capital did not catch it.
This article is about where the growth actually went, why the capital is hollowing out while its metropolitan area expands, and — most importantly — what other cities facing the same problem have done about it.
The Migration Pattern
The cleanest way to see what is happening to St. John's is to compare it against the towns surrounding it.
Between the 2016 and 2021 censuses, the City of St. John's grew by 1.5%, from 108,860 residents to 110,515. Over the same five-year window, Paradise grew 7.3%, Conception Bay South grew 3.7%, and the entire province of Newfoundland and Labrador declined by 1.8%. The capital was growing slower than its own suburbs by a factor of five.
The Census Metropolitan Area as a whole jumped from 220,052 in 2021 to 243,478 in 2025 — a 10.6% surge driven by immigration recovery and the return of offshore oil activity — which on its own is an extraordinary rate of growth for the region. That growth landed somewhere. Looking at Paradise's median age of 38, its 67.3% employment rate, and its share of new housing construction over the same period, it landed disproportionately in the ring municipalities. The working-age, family-forming, higher-earning demographic — the cohort every city competes for — chose to live ten minutes outside the city limits.
The pattern repeats in housing starts. According to Canada Mortgage and Housing Corporation data published in the City's own State of the Economy report, the City of St. John's has captured an average of just over 40% of CMA-wide housing starts over the last decade, despite holding roughly 52% of the CMA's population. Every year, the suburbs around the capital build more housing per resident than the capital does.
The Development Penalty
There is no mystery about why this is happening. The City of St. John's charges a commercial mill rate of 29.5. Paradise, Conception Bay South, and Mount Pearl all sit at 11.5.
That gap is 2.57 times. On a million-dollar commercial property, the difference is $18,000 a year - every year, forever. On a five-million-dollar build, it is $90,000 a year. No developer with access to a spreadsheet chooses to build commercial inside St. John's when identical land with full city services sits a five to fifteen-minute drive away in CBS or Paradise. Galway sits exactly where it sits — on the western edge of the city, straddling the boundary with the suburbs — for this reason.
The residential side is less stark but moving in the same direction. The City raised its residential mill rate 9.64% in 2024 alone, taking it from 8.3 to 9.1, while the suburbs held the line. The 2024 increase added roughly $240 a year to the average homeowner's tax bill. The 2026 budget, tabled in December 2025, held the rate at 9.1 — but only because rising property assessments did the work the mill rate increase had previously done. Spending is up 4.8%; the homeowner pays more either way.
Then there is the regulatory friction. The City of St. John's took $10.4 million from the federal Housing Accelerator Fund in 2024 explicitly to "cut down on red tape" — a tacit admission from the city itself that its development regulations were a problem. Councillor Maggie Burton, speaking publicly that year, said of the system: "You have to go through a lot of steps in order to get an application approved, and there's just so much risk involved." That is a sitting councillor describing her own city's process.
Kelly Rogers, executive of the Canadian Home Builders Association of Newfoundland and Labrador, named "increases in development fees and taxes" as a primary cause of construction slowdown in April 2025. The CHBA does not publicly bring this up lightly.
The Capacity Paradox: Vast Land, Slow Growth
The defence the City of St. John's is most likely to offer is geographic: the city covers 446 square kilometres, includes watersheds and rural areas, and therefore should not be expected to develop as intensively as small, fully-urban suburbs. The data does not support that defence. It indicts the city further.
Northeast Avalon at the 2021 Census (ordered by population)
- City of St. John's — 110,515 residents on 446.04 km² of land. Density: 248 people/km². Growth 2016–2021: +1.5%.
- Conception Bay South — 27,168 residents on 59.72 km². Density: 455/km². Growth: +3.7%.
- Paradise — 22,957 residents on 29.67 km². Density: 774/km². Growth: +7.3%.
- Mount Pearl — 22,477 residents on 15.65 km². Density: 1,436/km² (built out). Growth: −2.8%.
- Portugal Cove–St. Philip's — 8,415 residents on 57.61 km². Density: 146/km². Growth: +3.3%.
- Torbay* — 7,852 residents on 34.89 km². Density: 225/km². Growth: −0.6%.
- Logy Bay–Middle Cove–Outer Cove — 2,364 residents on 16.99 km². Density: 139/km². Growth: +6.4%.
*Torbay's 2016–2021 figure reflects an effective development slowdown tied to PFAS contamination of the town's planned future water supply at South Pond, originating from the federal firefighter training site at St. John's International Airport (active early 1980s through 2004). A class action filed November 2024 in the Federal Court of Canada involves roughly 700 affected households across Torbay and Logy Bay–Middle Cove–Outer Cove. Backing out the constraint, Torbay's natural trajectory would almost certainly have tracked the Paradise/LBMCOC growth band over this period.
The City of St. John's controls 446 square kilometres of land. The combined land area of the six surrounding municipalities in the table is 214.5 km² — less than half of what the capital alone holds. By area, St. John's is the metro.
Now look at density. Mount Pearl runs at 1,436 people per square kilometre. Paradise at 774. CBS at 455. The City of St. John's sits at 248 — roughly one-third of Paradise's density and one-sixth of Mount Pearl's. The capital is the lowest-density major municipality in the metro by a wide margin, and it is also the most land-rich.
The defence that "we have watersheds and rural areas" runs into two problems. First, the population growth. On a percentage basis, the City of St. John's grew slower than every neighbouring municipality that wasn't operating under an active external constraint. Second, the most striking growth in the above comes from the smallest municipalities — Paradise on 30 km², Logy Bay–Middle Cove–Outer Cove on 17 km². These towns are growing fastest because their entitlement processes are fast, their commercial rates are competitive, and their councils want development. They are not winning because they have unused land. They are winning because they are using the little land they have.
Mount Pearl illustrates the ceiling case. Fully built out at 1,436 people per square kilometre, landlocked on all four sides by St. John's and Paradise, the city has no remaining capacity. Its population actually declined 2.8% from 2016 to 2021. A historical footnote here is worth raising. In 1998, the provincial government granted the Southlands area to the City of St. John's. Southlands had been central to Mount Pearl's future expansion plans — it was the corridor the smaller city had been counting on for its next phase of growth. Mount Pearl had counted on it. The province awarded it to the capital instead. St. John's got the land. Mount Pearl hit its ceiling. St. John's did not use what it was given at the pace its smaller neighbour would have. That single decision encapsulates the structural problem in miniature: the capital absorbs developable land it cannot or will not develop efficiently while denser neighbours hit hard physical limits.
The cleanest reading of the above is the simple one. The City of St. John's is the only major municipality in the metro that is growing slowly while still possessing land, infrastructure, and institutional capacity to grow faster. Mount Pearl is constrained by geography. Torbay was constrained by federal contamination. Every other municipality is growing — some quickly, some moderately — because their constraints are policy choices and their policies say yes. The capital's constraints are also policy choices. Its policies have been saying no.
The City's Own Admission
The most damning evidence is not in any opposition's analysis. It is in the City's own 2026 Budget Book, tabled December 15, 2025, in Deputy Mayor Ron Ellsworth's budget speech:
"St. John's is growing, but our ability to raise revenue hasn't kept up — we rely almost entirely on property and water taxes, which is not sustainable. Municipalities invest heavily in infrastructure, housing, and economic growth, yet the revenue returns primarily benefit other levels of government. Events, construction, job creation, and tourism contribute significantly to HST and income tax, but municipalities do not receive a share of the revenue."
This is the City of St. John's, in its own budget document, stating that the financial model is broken. The mayor's office is now actively lobbying the provincial government for HST sharing because the property tax base alone cannot fund the city's services. The 4.8% spending growth in the 2026 budget is funded almost entirely by reassessment of existing property values — not by new properties added to the roll. The city is squeezing more from the same assets, because it is not adding new ones at the rate its neighbours are.
This is the textbook signature of what urban economists call fiscal disparity in a fragmented metropolitan area. The core city carries the cost of regional infrastructure — major hospitals, social services, transit hubs, homeless services, heritage maintenance, cultural facilities — but can only tax inside its own borders. The suburbs offer lower taxes because they do not carry those costs. Businesses and residents respond rationally and choose the suburbs. The core raises its rates to compensate. More businesses leave. The loop tightens.
St. John's is not the first city to find itself here. It is the next in a long line.
How Other Cities Solved This
Four approaches have been documented to actually break the cycle. They are not equally available politically, and they are not equally fast.
The first is amalgamation. Halifax did this in 1996. The Nova Scotia government legislated the merger of Halifax, Dartmouth, Bedford, and Halifax County into a single municipality — Halifax Regional Municipality. The new entity captured the entire metro tax base in one stroke, eliminated the race to the bottom on commercial rates, and unified regional planning under one council. Three decades later, Halifax CMA grows two to three times faster than St. John's CMA, attracts disproportionate Atlantic Canada investment, and operates as the dominant Atlantic capital. Toronto did the same in 1998. Montreal in 2002. Indianapolis ran Unigov in 1970. Winnipeg in 1972. In every case, the result is a more competitive, faster-growing metro with healthier core-city finances.
The Northeast Avalon amalgamation conversation has been on the table in Newfoundland and Labrador since the 1990s and has died politically every time. It is the option most likely to actually solve the problem, and the option least likely to happen in the next decade.
The second is metropolitan tax-base sharing. The Minneapolis–Saint Paul Fiscal Disparities Program, enacted by the Minnesota legislature in 1971, pools 40% of the year-over-year growth in commercial and industrial property tax base across the seven-county Twin Cities region and redistributes it by population and need. A new factory in suburban Bloomington partially benefits Minneapolis. A new office tower downtown partially benefits St. Paul. The incentive to compete on tax breaks vanishes because no jurisdiction captures all of the gain. The program has run for 54 years, has bipartisan support, and redistributes roughly $500 million annually. Municipalities keep their councils, their identities, and their autonomy — they just share the growth of the commercial base.
This is the option an honest provincial government would propose for the Northeast Avalon. It is politically much easier than amalgamation because nobody loses their town hall.
The third is anchor-driven core reinvention. Pittsburgh did this after the collapse of its steel industry. Carnegie Mellon, the University of Pittsburgh, and UPMC were treated as deliberate engines of downtown redevelopment, concentrated in walkable districts, supported by Tax-Increment Financing zones and by-right zoning that made redevelopment cheap. Three Rivers waterfront became a mixed-use spine. Today Pittsburgh's core is denser, younger, and richer than it was in 1980.
Hamilton, Ontario, ran the Canadian version of the same playbook after the decline of its steel sector and the suburban capture of growth by Burlington and Oakville — the local equivalents of Paradise and CBS. McMaster University became the anchor. Brownfield redevelopment programs freed up old industrial land. The commercial-to-residential mill rate ratio is being slowly compressed. Population recovery is now real after thirty years of decline.
For St. John's, the institutional spine along Elizabeth Avenue and Prince Philip Drive — Memorial University, the Marine Institute, and the Health Sciences Centre — already functions as a working anchor district, supporting research, employment, and the neighbourhoods adjacent to it. It is not where the urgent problem lies.
The urgent problem is downtown. The downtown core — Water Street, Duckworth Street, George Street, the cathedral district, and the harbourfront — is the city's most visible asset and its primary heritage and tourism identity. It is also the zone where the hollowing-out is most legible. Vacant upper floors, surface parking on prime parcels, ground-floor retail vacancies outside the George Street strip, and a downtown residential population that has been essentially flat for two decades all reflect the same underlying problem: the development model has been pushing growth outward to the suburbs instead of building density at the heart of the city. The Rooms, the St. John's Convention Centre, and the harbourfront are real anchors. None of them is yet being treated as the engine of a coordinated downtown reinvention strategy.
The fourth is provincial revenue sharing. This is the option the City of St. John's is currently asking for. Quebec shares a portion of QST and fuel-tax revenue with municipalities. The federal Canada Community-Building Fund does this nationally. The Northwest Territories shares territorial revenue. Most European countries treat municipal finance this way as the default. It works. It is the easiest political ask. It is also the least sufficient of the four options because it closes the revenue gap without fixing the structural rate-flight problem underneath.
The Saint John Comparator
The most important comparator for St. John's is not in Minnesota or Pittsburgh. It is in New Brunswick.
Five years ago, Saint John, NB looked very much like St. John's, NL does today: declining population, hollowing core, suburb capture by Quispamsis and Rothesay, an over-reliance on property tax, and a provincial government slow to act. In 2024, Saint John recorded a population growth rate of 3.9% — the highest the city had seen since the early 1980s. The Census Metropolitan Area grew 2.4%. Of the regional growth, 87% landed inside the city limits.
What changed in Saint John was concrete and replicable. Council set an explicit 2% annual growth target with public accountability. The city aggressively deployed federal Housing Accelerator Fund money on regulatory reform rather than incremental tweaks. Council reframed property tax reform as a provincial issue requiring provincial action — and got political traction for it. Long-term debt was reduced 46% from $119 million to roughly $64 million. The residential tax rate was reduced slightly while the city continued to grow.
St. John's, NL has access to the same federal funding, the same provincial advocacy channels, and the same regulatory levers. It has not yet made the same political choices.
What Could Realistically Work Here
The pragmatic strategy combines three of the four options and treats amalgamation as the long-horizon goal.
The City of St. John's should bring the commercial mill rate down aggressively — from 29.5 toward 18–20 over five years — financed by HST sharing from the province and Tax-Increment Financing capture from designated redevelopment districts. The downtown core — Water Street, Duckworth Street, George Street, and the harbourfront — should be formalized as a priority redevelopment district with by-right zoning, fast-track permitting, pre-approved heritage-compatible building designs, and targeted incentives for upper-floor residential conversions and infill on surface parking lots.
In parallel, the provincial government should be presented with a serious proposal for a Northeast Avalon Fiscal Disparities Program modelled on Twin Cities — explicitly framed as the alternative to amalgamation, which makes it politically palatable to suburbs who fear merger. Halifax HRM and the Twin Cities case studies are the comparators worth bringing to the table.
None of this is theoretical. The tools exist. The case studies exist. The political will is the question.
Why This Matters Beyond Municipal Politics
If Newfoundland and Labrador is going to position itself meaningfully in Atlantic Canada — for federal investment, for trade, for European institutional engagement, for the next wave of offshore and onshore resource development — the capital city has to function as a capital city. A St. John's that is shedding tax base, rejecting three of every four new-build applications, and asking the province to share HST because it cannot fund itself is not a capital city that can be the operational seat of a serious provincial ambition. Federal departments, NATO partners, and North American/European investors look at the host city when they evaluate the host province.
The numbers in this article are not a critique of the people running the city. They are a description of a long-term structural problem the city itself has documented in its own budget book. Every Atlantic Canadian city that has faced this problem has fixed it. Halifax did it. Saint John is doing it now. Pittsburgh and Hamilton did it before us. The playbook is recent, proven, and in some cases sitting on bookshelves a ninety-minute flight away.
The growth is here. The question is whether the capital will keep choosing to send it next door.
L|S Real Estate Group, based at 17 Duffy Place Suite 200, St. John's, works with buyers, sellers, and commercial clients across the Northeast Avalon. We believe the regional real estate market is best understood structurally, not just transactionally. For commercial and residential brokerage in St. John's, Paradise, CBS, Mount Pearl, and surrounding communities, visit lsre.ca or call 709-771-4448.
Sources
- City of St. John's, 2026 Budget Book and Budget Speech, December 15, 2025
- City of St. John's, 2025 Economic Review, March 2026
- City of St. John's, July 2024 State of the Economy
- City of St. John's, Residential Building Permits Dashboard (2025–2026)
- Statistics Canada, Census of Population, 2016 and 2021 (population, land area, and density data for St. John's, Mount Pearl, Conception Bay South, Paradise, Portugal Cove–St. Philip's, Torbay, and Logy Bay–Middle Cove–Outer Cove)
- Newfoundland & Labrador Statistics Agency, Population Estimates 2006–2025
- Canada Mortgage and Housing Corporation, Monthly Housing Starts data
- CBC News, "Property taxes going up in 2024 as St. John's struggles with higher costs," December 2023
- CBC News, "Red tape, labour shortage preventing homes from being built," April 2025
- CBC News, "St. John's proposes changes to development regulations," April 2024
- CBC News, "Torbay greenlights new water development as residents struggle with town supply, wells," January 2026
- The Globe and Mail, "Federal agency failed to track 'forever chemicals' in Newfoundland town's water, residents say," October 2025
- McInnes Cooper, Southeast Torbay PFAS Class Action filings (Federal Court of Canada, November 2024–present)
- Water Canada, "Torbay Finds Contaminants in Potential Water Supply," October 2017
- Saint John, NB, "Reason to celebrate: Saint John achieves historic population growth in 2024," January 2025
- Twin Cities Fiscal Disparities Program, Metropolitan Council of the Twin Cities (1971–present)
- Halifax Regional Municipality Act, 1995